
The Coronavirus – Modeling the Spread

March 17, 2020
The following is an op-ed submitted by senior Will Pattie, who is an participant in the LFHS Music Department, both as a member of the band and a capella group Lowkey Treble. He would like us to note that he is not an Epidemiologist, but merely a high schooler who likes numbers. Want to share on opinion of your own? Send an op-ed to [email protected].

Suppose I have a bottle of bacteria and the number of bacteria in the bottle will double every minute. At 9 a.m. the number of bacteria in the bottle is 1, and at 10 a.m., the bottle will be full. At what time would you observe the bottle to be half full?
The answer is 9:59 a.m., merely 1 minute before the bottle is completely full. Now, if you were watching this bottle fill up with bacteria, at what point would you realize that you were running out of space? Well at 9:59 am it’s half full, at 9:58 am it’s a quarter full, at 9:57 a.m. it’s an eighth full, etc. So you’d probably realize you were running out of space sometime around 9:58 a.m., which is 96.7% of the way to 10 a.m. By the time you realize you’re running out of space, you’re helpless to do anything about it.
The lesson here? Never doubt the growth of an exponential function. It may look like you still have lots of space left in your bottle, but in reality, you might be only one or two minutes away from it being completely full.
As of March 15th, only 3,680 people in the United States are infected with the Coronavirus (less than 12 people per million), but the spread of the disease can be modeled exponentially similar to the jar of bacteria. In the early days of spread in the United States, there would be 3 or 4 new cases of the virus per day. On March 12th, there were 396 new US cases, and on March 13th, there were 550. We should expect that number to keep increasing too, as more and more people contract the virus.
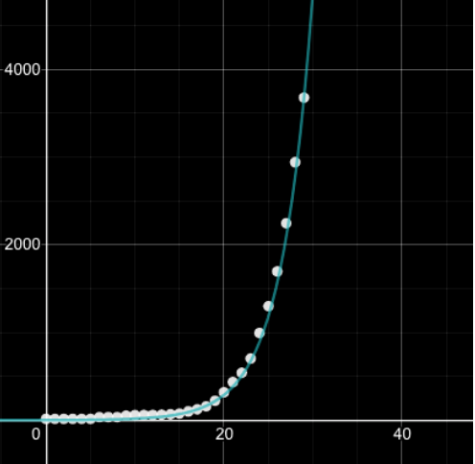
If we were to model the current US cases of the coronavirus, we would get a graph that looks like this (X-axis = day where February 15th is day 0, Y-axis = total number of reported cases)
Extrapolating this out, we see 20,000 total cases by March 21st, 100,000 total cases by March 27th, and over a million cases by April 6th. There are problems with this type of extrapolation, however, in that there isn’t an infinite number of people in the United States, and thus, the number of reported cases logically cannot approach infinity. So what we need to do is establish a limit for the graph by using the logarithmic equation: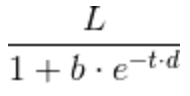
We’ll start by taking the CDC’s worst-case scenario estimate, 214 million total cases, and calling that the limit of the graph. In addition, we’ll add into the graph a line for active cases (people who still have the virus) based on the current rate of new active cases, and we’ll add in recovered/dead people based on the rate at which active cases have resolved. Modeling these we get the following: (Green = total cases, blue = recovered/dead, pink = active cases. X-axis = day where February 15th is day 0, Y-axis = people).
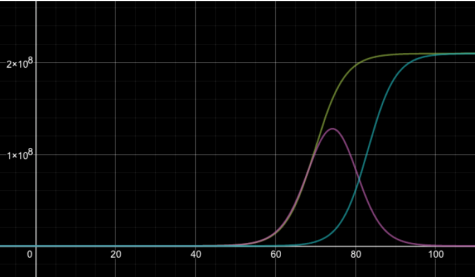
At this rate, assuming the 214 million total case estimate comes true, cases will start slowing down on April 24nd, active cases will peak around May 1st, and active cases will drop to negligible amounts around June 3rd. If we look at a lower estimate, 70 million, active cases will peak April 29th and drop to negligible amounts around May 27th. Going back to our bacteria analogy, the US is at 9:20 am.
If these estimates come true, we should expect eLearning to continue past April 6th because even when we’re at that date, the spread of the virus will still be accelerating. Also, having all these cases in such a short period of time puts a huge strain on hospitals that will likely run out of space if the new number of infected increases at this rate. The United States has to do something about the Coronavirus because the current rate of spread could potentially be ruinous.
Yet, of course, this extrapolation cannot be taken as fact. This graph is based on the number of reported cases which doesn’t match the number of actual cases, as some infected people have symptoms so mild that they will never get tested. The real number of cases is likely much higher than the reported number. In addition, any future quarantines or travel bans will hopefully slow the rate of spread, but assuming current rates of spread/recovery, this is around what we should expect.
A better way we can model this spread is through something known as the SIR (Susceptible, Infected, Recovered) model which is commonly used to model the rate of spread of infectious diseases. The logic behind this model is that each infected person (I) has an X percent chance of infecting a susceptible person (S), and a Y chance of either dying or recovering (R) each day. We can use the following equations to model the Coronavirus:
S = Total population – Infected – Recovered/Dead
I = (Yesterday’s infected * % chance of infecting someone * % of the population that’s susceptible) + Yesterday’s infected – Yesterday’s dead/recovered
R = Total recovered + total dead
We know that as of now, each infected person in the US has about a 33% chance of infecting someone each day, the recovery time for the Coronavirus is about 14 days, and the death rate of the virus is around 1% after estimating unreported cases.
The current rate of infection cannot be sustained, however, because although over the first 26 days of spread there was a 33% chance that an infected person spreads the virus on a given day, going forward there are canceled schools, banned travel from Europe, no spring baseball games, etc. So as we continue forward and people have less person to person interaction, the odds of an infected person spreading the disease each day will drop.
This is the equivalent of having our bacteria multiply by a lower number such as 1.5 each day, rather than doubling.
If we can drop the chance an infected person spreads the disease each day down to, for instance, 10%, the SIR model projects that there are 168 million total cases, active cases don’t peak until late October, and there are 1.6 million deaths.
If we drop the chance even further down to 8% we find only 67 million cases and that the number of active cases doesn’t peak for over a year. Theoretically, we could drop this number down to 0% and prevent any future spread, but that would require locking everyone in separate rooms for the next month which is not a feasible plan.
Going forward we have to try and drop this rate as much as we can because there’s a huge difference between keeping the spread at 33% and dropping it down to a number such as 8% in terms of strain on our hospitals and number of casualties.
So, is it time to panic? Time to lock yourself in your basement and ration your food? No, not right now. As of today, your chances of contracting the virus are slim and estimates that take into account unreported cases put the death rate around 1%. If you’re a kid reading this, that death rate is practically 0%. Of course, any number of deaths is terrible, but with doomsday scenarios and tragedies, the widespread panic can sometimes do more damage than the tragedy itself.
It is important, however, that we all do our part to protect against any future spread. My advice to you is: wash your hands, don’t attend large gatherings, and cover your mouth when you cough, because only through the collective efforts of everyone can we slow the rate of infection.


Erin • Mar 19, 2020 at 10:57 am
He’s gonna save us all